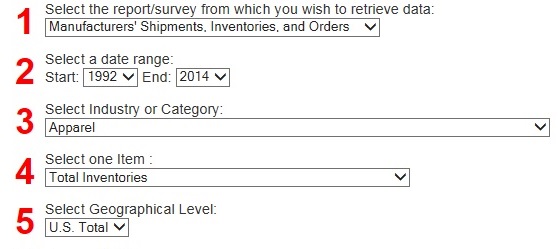
Apparel Manufacturers Total Inventories, 1992-2014
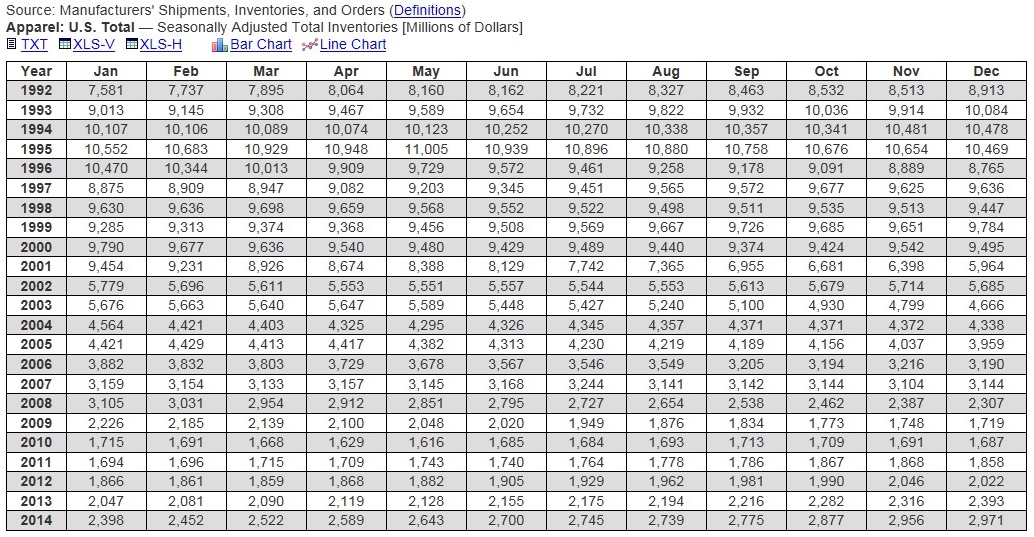
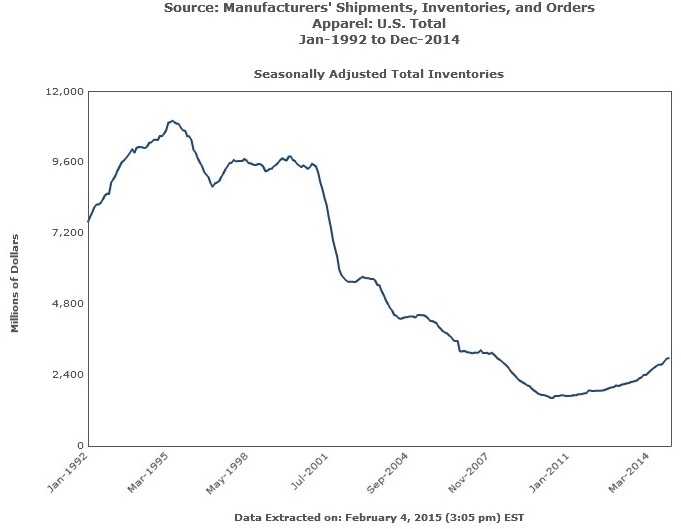
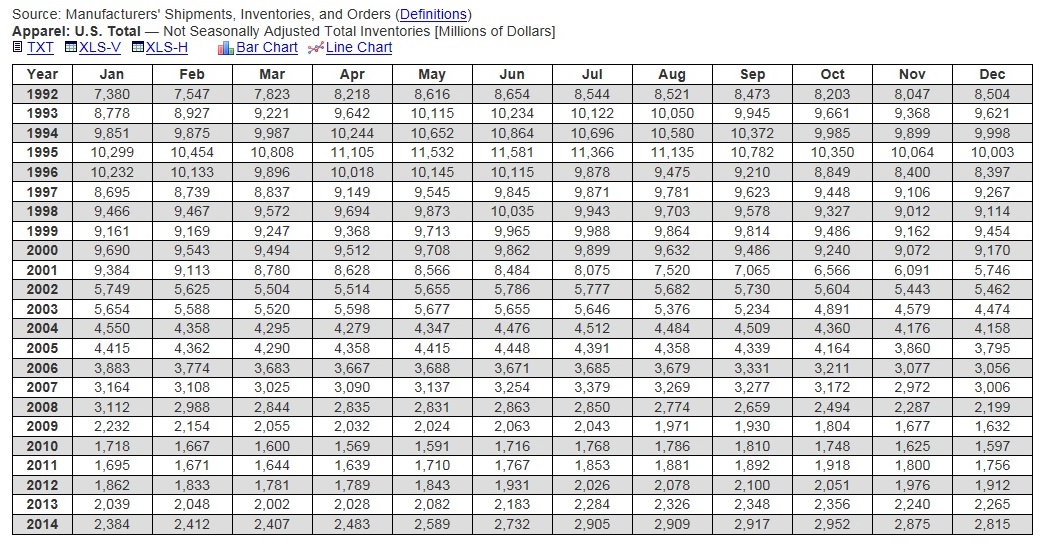
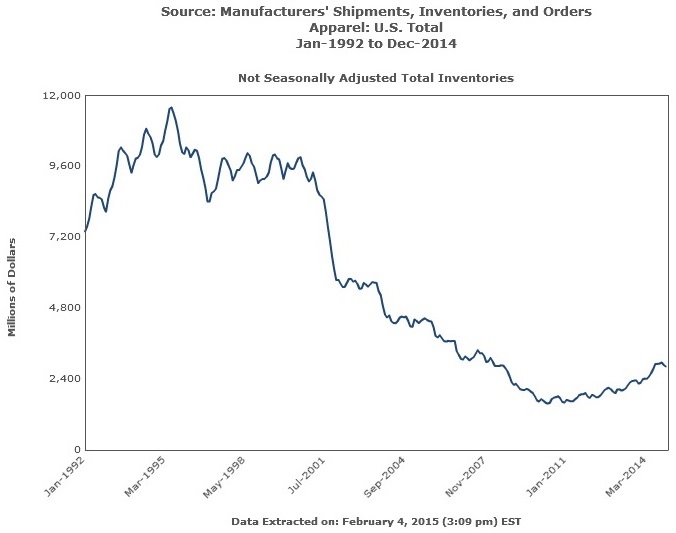
Census M3 charts of what apparel manufacturers held in inventory, 1992 to 2014
These charts track apparel manufacturers' total inventories from 1992 to 2014, built from United States Census data retrieved on February 4, 2015. Inventories are the industry's shock absorber and its risk: stock held against orders not yet shipped, in an industry where fashion change can strand a warehouse. The charts present the Manufacturers' Shipments, Inventories, and Orders (M3) survey series in seasonally adjusted and not seasonally adjusted form, with bar and line presentations, and the survey's definitions and revision notes are carried with the data so the series can be read on its own terms. The figures are historical reference; revisions to source data may occur, and the charts are not updated.

Apparel Search has utilized data from the USA Census to create the following historical information to help fashion industry researchers learn more about our industry. The data was retrieved on February 4, 2015.
Revisions to the original source data may occur, but we will NOT be
updating the charts listed on this page. If you wish to utilize this
information, it is important to keep in mind that the data can possibly be
outdated due to potential revisions.
The Y-axis for the line charts may be truncated to prevent flattening of the
lines or to present the complete range of data.
Revised historical data for Manufacturers' Shipments, Inventories, and
Orders will be issued on May 14, 2015. These revisions reflect benchmarking
the shipments and inventories data to the 2012 Economic Census and 2013
Annual Survey of Manufactures (ASM) data on a 2012 NAICS basis, as well as
revised ASM benchmarks for prior years on a 2007 NAICS basis; incorporating
the unfilled orders to shipments ratios obtained from the 2013/2012 and
2012/2011 Manufacturers' Unfilled Orders Survey by applying these ratios to
the respective Census or ASM shipments data, as well as incorporating
revised unfilled orders to shipments ratios for prior years; adjusting the
new orders data to be consistent with the benchmarked shipments and unfilled
orders data; correcting monthly data for late receipts, reclassifications of
reported data, and revisions to previously reported data; and updating the
seasonally adjusted data based on the results of benchmarking and the recent
annual review of the seasonal adjustment models. These revisions will span
the seasonally adjusted data for January 1997 through March 2015 and the
data not seasonally adjusted for January 2001 through March 2015. An updated
Press Release will contain revised monthly tables for January 2015 through
March 2015 on a 2012 North American Industry Classification System (NAICS)
basis, which will be the new basis for publishing data from the M3 Survey
starting with the April 2015 Advance Report on Durable Goods.
For the Manufacturers' Shipments, Inventories, and Orders Survey, all
current month estimates are preliminary estimates and will be superseded in
following months by revised estimates.
For information on survey methodology and use of the data, including
seasonal adjustment and other information pertinent to this economic
indicator, go to the
Manufacturers' Shipments, Inventories, and Orders
website, which provides a link to
historical data.
Definitions
Shipments - Manufacturers' shipments measure the dollar value of products
sold by manufacturing establishments and are based on net selling values,
f.o.b. (free on board) plant, after discounts and allowances are excluded.
Freight charges and excise taxes are excluded. Where the products of an
industry are customarily delivered to distributors or consumers by the
manufacturing establishment (such as in certain foods industries – fluid
milk, bakery, soft drinks), the value is based on delivered price rather
than f.o.b. plant price. Multi-industry companies report value information
for each industry category as if it were a separate economic unit. Thus,
products transferred from one plant to another are valued at their full
economic value.
New Orders - A new order is a communication of an intention to buy for
immediate or future delivery. Orders data are not collected from industries
that have mostly immediate deliveries. See Part H to determine if the M3
survey request orders data for your industry category. Only orders supported
by binding legal documents (such as signed contracts, letters of intent, or
letters of award) should be included. Reported data should include all new
orders received during the month less cancellations.
Order Backlog (Unfilled Orders) - Generally, unfilled orders at the end of
an accounting period are equal to unfilled orders at the beginning of the
period, plus new orders net of cancellations received during the period,
less net sales. This includes orders that have not yet passed through the
sales account and funded orders (or portions of orders) for which the value
of work done has not been reported as sales.
Total Inventory - Total inventories represent the value of the end-of-month
stocks regardless of stage of fabrication (whether in the form of purchased
materials and supplies, work in process, or finished goods). These
inventories are valued at cost using any valuation method other than LIFO.
Inventories associated with the non-manufacturing activities of your company
are excluded.
Materials-and-Supplies Inventory - All unprocessed raw and semifabricated
commodities and supplies for which you have title.
Work-in-Process Inventory - Accumulated costs of all commodities undergoing
fabrication within your plants and long-term contracts where the inventory
costs are for undelivered items and the value of work done that has not been
reported in sales.
Finished Good Inventory - The value of all completed products ready for
shipment and all inventories and goods bought for resale requiring no
further processing or assembly. No accumulation of finished goods
inventories should occur with long-term contracts unless the total sales
receipts are not recorded until the time of delivery.
You can learn more at census.gov
Apparel Search will not be offering support regarding how to utilize the
information outlined above.
Again, future updates to the original data may take place from the government resources that supplied the original statistics. We will NOT be updating the charts and figures on this page. You can use this for historical reference only based on the date we retrieved the statistical data for these reports.
Benchmarks, Revisions and How This Series Was Built
The M3 survey's own revision program frames the data. Revised historical data for Manufacturers' Shipments, Inventories, and Orders was scheduled for release on May 14, 2015, benchmarking shipments and inventories to the 2012 Economic Census and the 2013 Annual Survey of Manufactures on a 2012 NAICS basis, with revised benchmarks for prior years on a 2007 NAICS basis. The revisions incorporated unfilled-orders-to-shipments ratios from the Manufacturers' Unfilled Orders Survey, corrected monthly data for late receipts and reclassifications, and updated the seasonally adjusted data from the annual review of the seasonal adjustment models, spanning seasonally adjusted data from January 1997 and unadjusted data from January 2001. All current-month M3 estimates are preliminary and are superseded by revised estimates in following months.
Within the survey's definitions, shipments measure the dollar value of products sold by manufacturing establishments at net selling values, f.o.b. plant, excluding freight charges and excise taxes, while inventories record the stock manufacturers hold against those shipments and orders. The line charts' Y-axes may be truncated to prevent flattening of the lines or to present the complete range of data — a presentation choice noted on the charts themselves, and one more reason to read values from the data rather than from the slope of a line. Paired with the value-of-shipments charts in this collection, the inventories series lets a researcher compute the industry's inventory position against its sales across the full 1992-2014 span.
Common Questions
What do these charts measure?
Apparel manufacturers' total inventories from 1992 to 2014, from the Census Bureau's Manufacturers' Shipments, Inventories, and Orders (M3) survey, in seasonally adjusted and not seasonally adjusted form.
When was the data retrieved, and is it updated?
The data was retrieved on February 4, 2015, and the charts are not updated; revisions to the source data may occur at the Census Bureau, so the series is historical reference.
How are shipments defined in the M3 survey?
Shipments measure the dollar value of products sold by manufacturing establishments, based on net selling values, f.o.b. plant, after discounts and allowances, excluding freight charges and excise taxes.