Fashion Industry Statistics 1992-2014
Charts of Census-based apparel industry data, 1992 to 2014
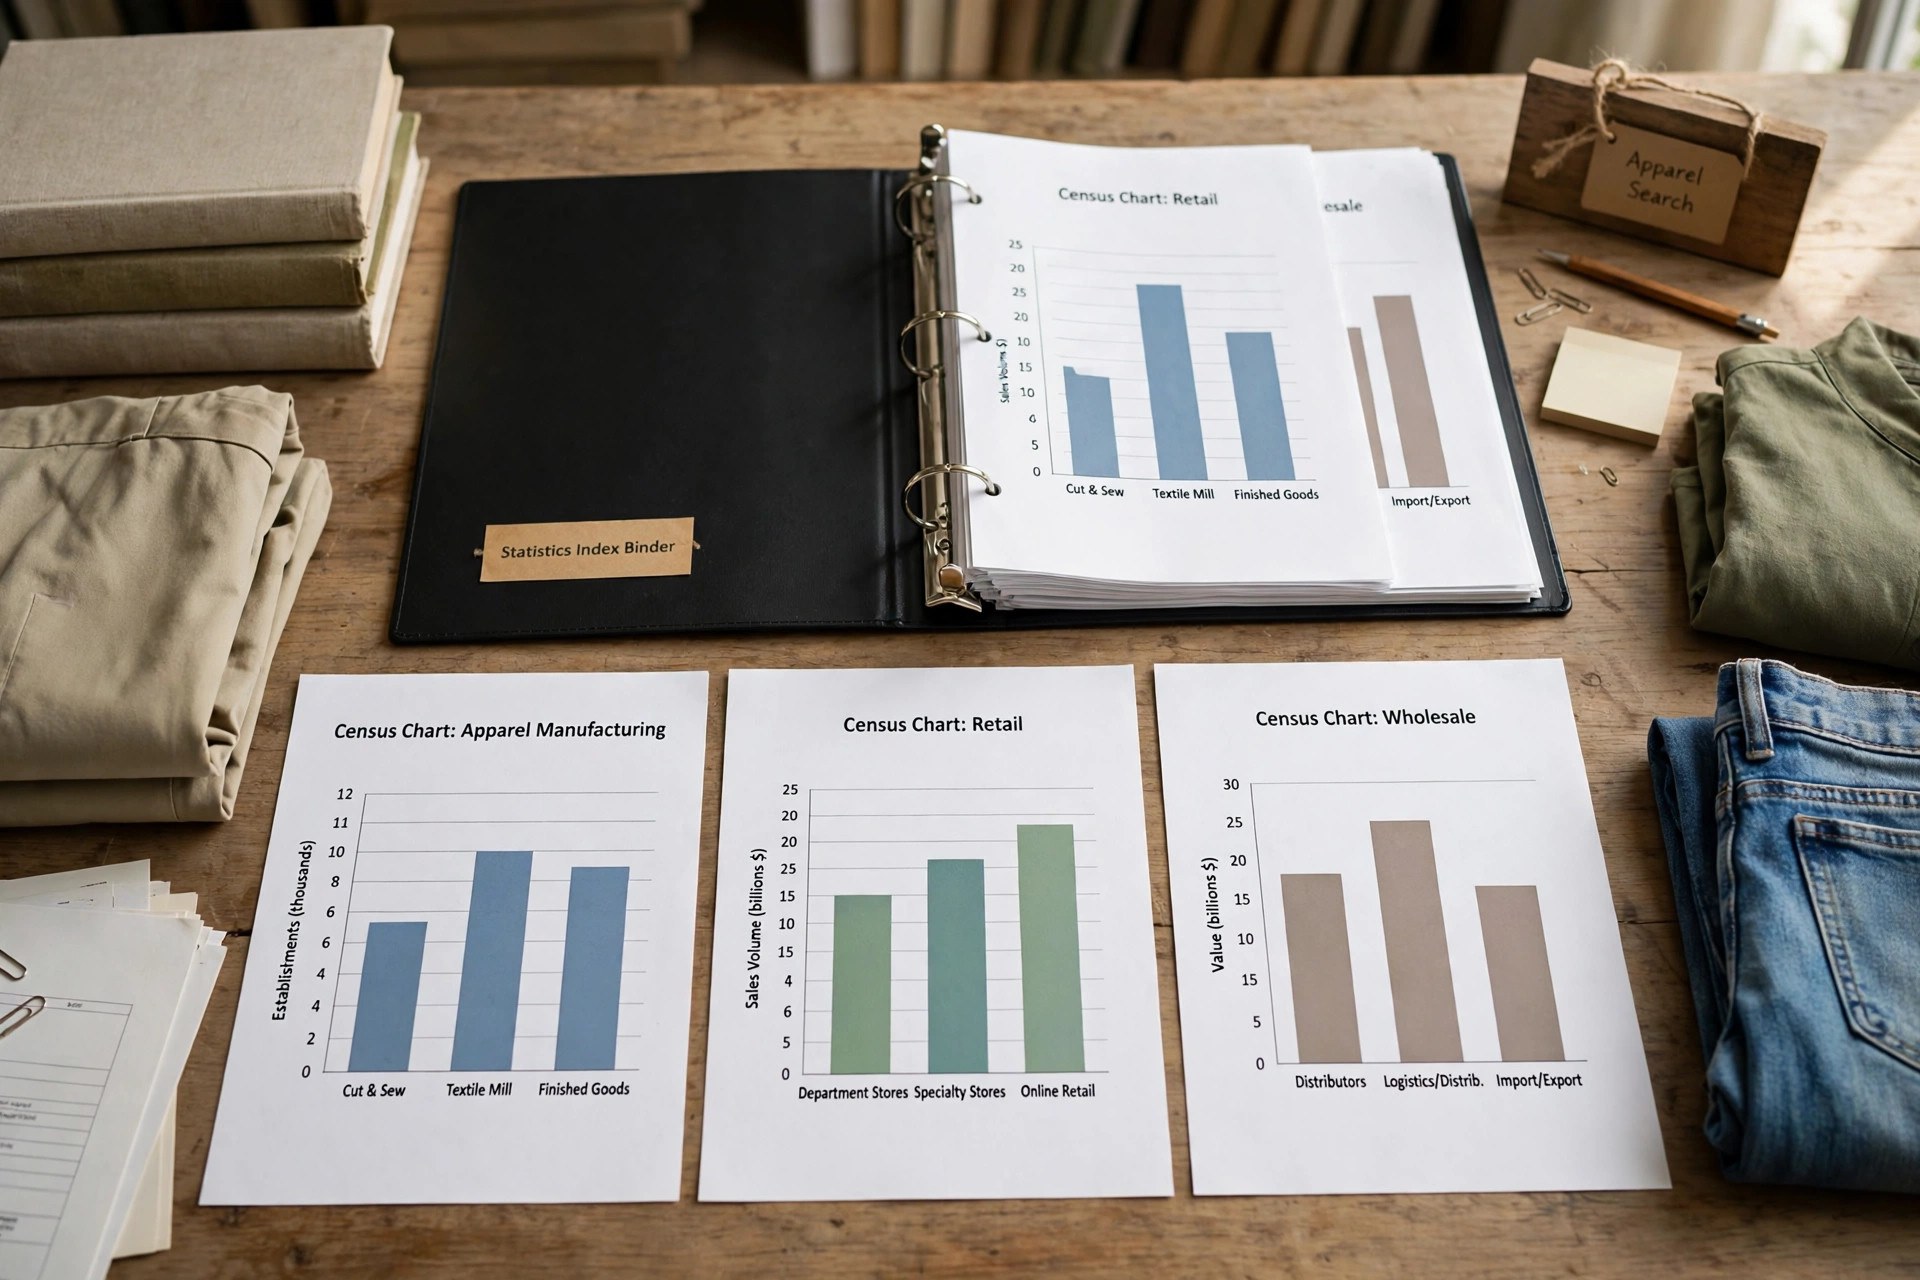
This index collects the fashion industry statistics charts built from United States Census data for the years 1992 to 2014. The collection follows the industry's chain from the factory to the shop floor: apparel manufacturers' value of shipments and total inventories, the Monthly Retail Trade Survey results for clothing stores overall and for men's, women's, shoe and jewelry stores separately, and the Monthly Wholesale Trade figures for apparel, piece goods and notions sales and inventories. Choose a chart set below to study the series for that part of the trade.
More to Explore
- Apparel Manufacturers Value of Shipments
- Apparel Manufacturers Total Inventories
- Clothing Stores Monthly Retail Trade Survey
- Men's Clothing Stores Monthly Retail Trade Survey
- Women's Clothing Stores Monthly Retail Trade Survey
- Shoe Stores Monthly Retail Trade Survey
- Jewelry Stores Monthly Retail Trade Survey
- Apparel, Piece Goods, and Notions Sales Monthly
- Apparel, Piece Goods, and Notions Inventory Monthly
- Fashion Industry Statistics
- Apparel Industry Research Reports
- Apparel Research
- Retail Statistics Definitions 1992-2014
- Wholesale Statistics Definitions 1992-2014
Are you ready to expand your level of knowledge? Here are a few
charts that we have whipped together for your educational enjoyment.
Apparel Manufacturers' Shipments, Inventories, and Orders
Apparel Manufacturers Value of Shipments (1992 to 2014)
Apparel Manufacturers Total Inventories (1992 to 2014)
Monthly Retail Trade Survey
Clothing Stores Monthly Retail Trade Survey (1992-2014)
Men's Clothing Stores Monthly Retail Trade Survey (1992-2014)
Women's Clothing Stores Monthly Retail Trade Survey (1992-2014)
Shoe Stores Monthly Retail Trade Survey (1992-2014)
Jewelry Stores Monthly Retail Trade Survey (1992-2014)
Monthly Wholesale Trade: Sales and Inventories
Apparel, Piece Goods, and Notions Sales Monthly
Apparel, Piece Goods, and Notions Inventory Monthly
Thank you for using the Apparel Search website to get smarter.
How the Collection Is Organized
Manufacturing comes first, because production leads the chain: the shipments series records the dollar value of what apparel manufacturers sold, and the inventories series records what they held, each running monthly from 1992 to 2014 in seasonally adjusted and not seasonally adjusted form. Retailing follows, with the clothing stores survey as the headline series and the men's, women's, shoe and jewelry store surveys breaking the shop-floor picture into its specialty parts — the same store types a high street is made of, tracked separately because their seasons and cycles differ. Wholesaling closes the chain: apparel, piece goods and notions move through merchant wholesalers whose monthly sales and inventory figures show the pipeline filling and draining between factory and retailer.
Every chart set carries its definitions and cautions with it. The retail definitions page explains the survey terms behind the retail series, and the wholesale definitions page does the same for the wholesale series, because a monthly figure means little until the reader knows what a shipment, an inventory or a seasonally adjusted estimate actually counts. The data behind all of the charts was retrieved from Census sources on February 4 and 5, 2015, and the charts are kept as historical reference for the 1992-2014 period: revisions to source data may occur at the Census Bureau, and these pages present the series as retrieved. Used together, the sets let a researcher trace one industry's two decades — through expansion, import competition and recession — in the government's own monthly measurements.
Reading Twenty-Two Years of Monthly Data
Monthly series reward patience: a single month's movement is mostly seasonal noise, which is why each chart set presents the seasonally adjusted view beside the unadjusted record. The adjusted series answers the research question — is the industry growing or shrinking underneath its calendar? — while the unadjusted series preserves the calendar itself, the December peaks and January troughs that govern apparel working capital. Comparing the manufacturing, retail and wholesale sets for the same period shows the chain's timing: wholesale inventories move before retail sales, and manufacturers' shipments lead both, which is what makes the three groups one collection rather than three separate curiosities.
Common Questions
What statistics are collected in the 1992-2014 chart sets?
Apparel manufacturers' value of shipments and total inventories, Monthly Retail Trade Survey results for clothing, men's, women's, shoe and jewelry stores, and Monthly Wholesale Trade sales and inventories for apparel, piece goods and notions.
Where does the data behind the charts come from?
The charts were built from United States Census data, retrieved on February 4 and 5, 2015, and are kept as historical reference for 1992 to 2014.
Why does each chart set include definitions pages?
The retail and wholesale definitions pages explain the survey terms — shipments, inventories, seasonal adjustment and sampling measures — so the monthly figures can be read correctly.