Monthly Retail Trade Survey: Shoe Stores, 1992-2014
Census monthly retail trade charts for shoe stores, 1992 to 2014
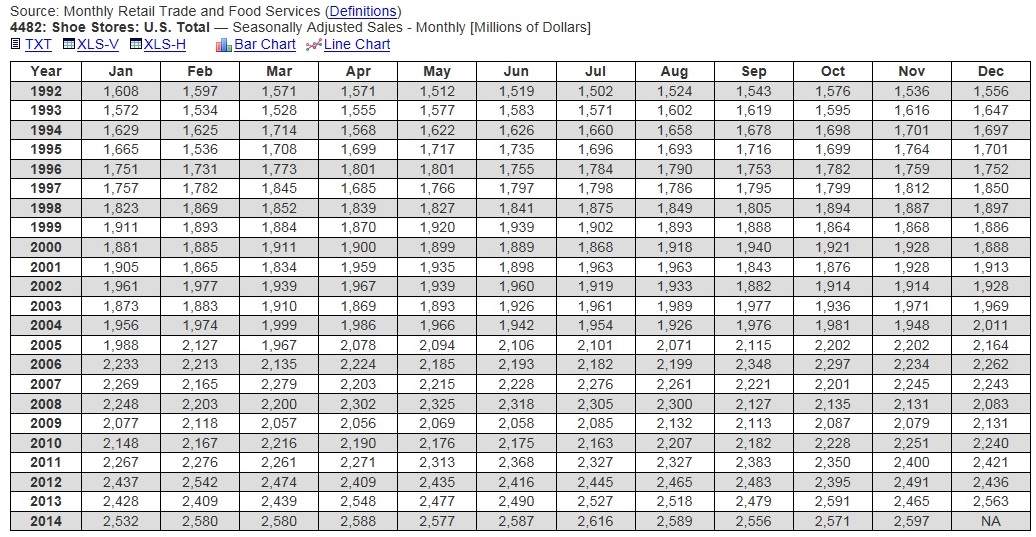
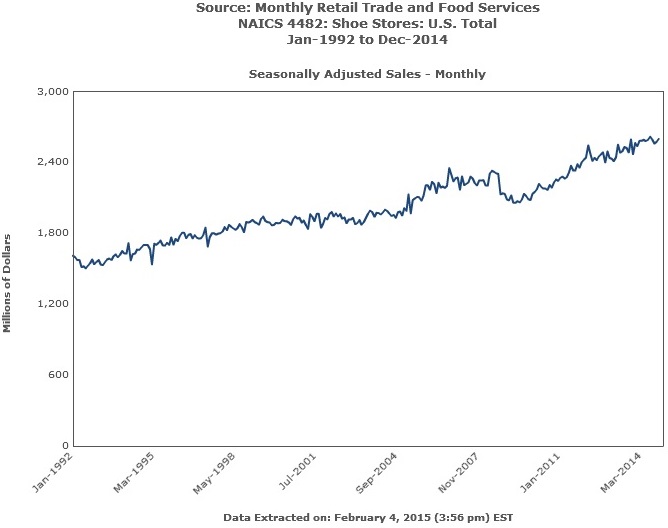
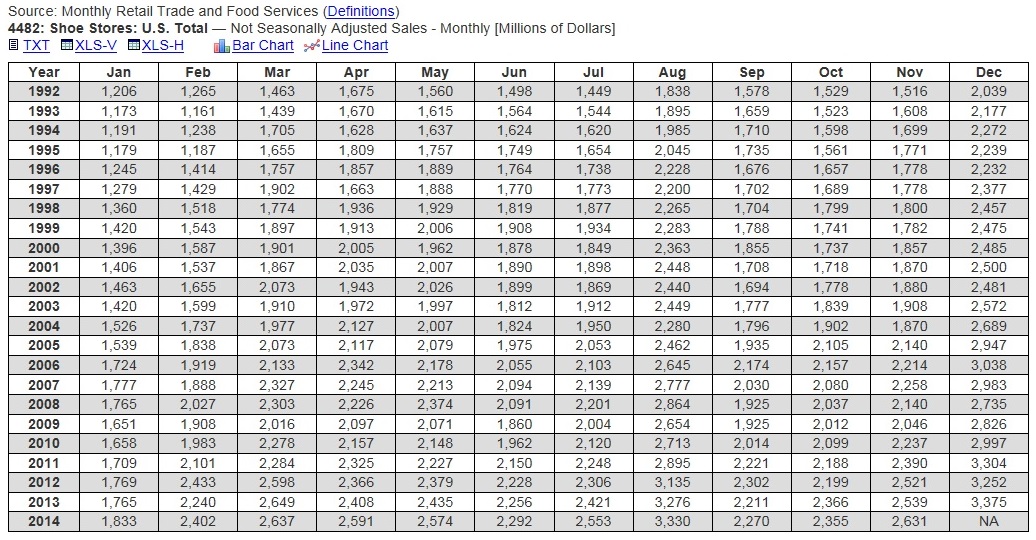
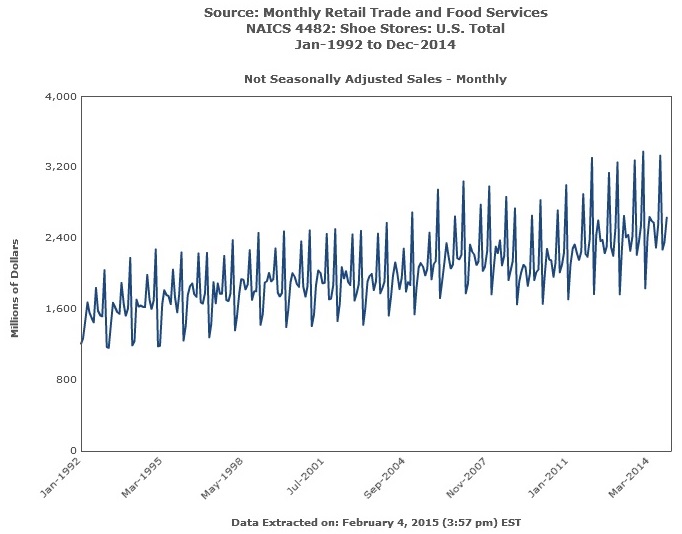
These charts present the Monthly Retail Trade Survey results for shoe stores from 1992 to 2014, built from United States Census data retrieved on February 4, 2015. Footwear is the apparel business's replacement-and-season hybrid: shoes wear out on a schedule clothing does not, and the back-to-school and boot seasons give the series its own rhythm inside the clothing stores aggregate. The charts present the series in seasonally adjusted and not seasonally adjusted form, each with a line chart, and the survey's notes on reliability, sampling variability and seasonal adjustment are carried with the data. The figures are historical reference; the charts are not updated, and revisions to source data may occur.

Apparel Search has utilized data from the USA Census to create the following historical information to help fashion industry researchers learn more about our industry. The data was retrieved on February 4, 2015.
Revisions to the original source data may occur, but we will NOT be updating the charts listed on this page. If you wish to utilize this information, it is important to keep in mind that the data can possibly be outdated due to potential revisions.
For the Monthly Retail Trade Survey, all current month estimates are
preliminary estimates, which will be superseded in following months by
revised estimates.
For information on the reliability and use of the data, including important
notes on estimation and sampling variance, seasonal adjustment, measures of
sampling variability, and other information pertinent to this economic
indicator, go to the
Monthly and Annual Retail Trade website, which provides time-series
Excel files for
Sales [XLS, 184kb], and
Inventories and Inventories/sales Ratios [XLS, 368kb] data.
Estimated measures of sampling variability for totals are expressed as
coefficients of variation (CV). Standard errors (SE) are provided for
month-to-month change and ratio estimates.
Estimated measures of sampling variability are based on data not adjusted
for seasonal variation, and should be used when drawing inferences about
both adjusted and not adjusted estimates.
Inventories are only available for the following industries (defined in Box
3 above): 44000, 4400A, 441, 4423X, 444, 445, 448, 452, 4521.
NA = Not available.
(S) = Suppressed.
The Y-axis for the line charts may be truncated to prevent flattening of the
lines or to present the complete range of data.
You can learn more at census.gov
Apparel Search will not be offering support regarding how to utilize the
information outlined above.
Again, future updates to the original data may take place from the government resources that supplied the original statistics. We will NOT be updating the charts and figures on this page. You can use this for historical reference only based on the date we retrieved the statistical data for these reports.
How the Monthly Retail Trade Survey Figures Work
All current-month estimates in the Monthly Retail Trade Survey are preliminary estimates, superseded in following months by revised estimates. The Bureau's documentation on reliability and use — estimation and sampling variance, seasonal adjustment and measures of sampling variability — accompanies the series, with time-series files for sales and for inventories and inventories/sales ratios published alongside. Estimated measures of sampling variability are expressed as coefficients of variation (CV), with standard errors (SE) provided for month-to-month change and ratio estimates, and those measures are based on data not adjusted for seasonal variation even when used to draw inferences about adjusted estimates. Inventories are available only for specified industries in the survey, and the tables use NA for not available and (S) for suppressed. The line charts' Y-axes may be truncated to prevent flattening of the lines or to present the complete range of data.
Reading the Shoe Stores Series
Shoe stores sit between necessity and fashion, and the series shows it: the adjusted line tends to move with consumer spending generally, while the unadjusted line keeps footwear's own calendar, including the late-summer back-to-school surge that has no equivalent in the jewelry or menswear breakouts. For researchers comparing categories across the 1992-2014 collection, footwear is the useful control — a category where fit keeps the physical store central, tracked through the same survey, definitions and revision discipline as the clothing lines beside it. The retail definitions page explains the survey vocabulary, and the clothing stores series provides the aggregate this breakout feeds into.
Common Questions
What do these charts measure?
Monthly Retail Trade Survey results for shoe stores from 1992 to 2014, from United States Census data retrieved February 4, 2015, in seasonally adjusted and not seasonally adjusted form.
What gives the shoe store series its own seasonal shape?
Footwear combines replacement demand with fashion demand, and seasons such as back-to-school and boot weather give shoe stores a rhythm distinct from the other specialty breakouts.
Are the monthly estimates final?
No. All current-month estimates are preliminary and will be superseded in following months by revised estimates.