Wholesale Apparel, Piece Goods and Notions: Monthly Inventory, 1992-2014
Census monthly wholesale inventory charts for apparel, piece goods and notions
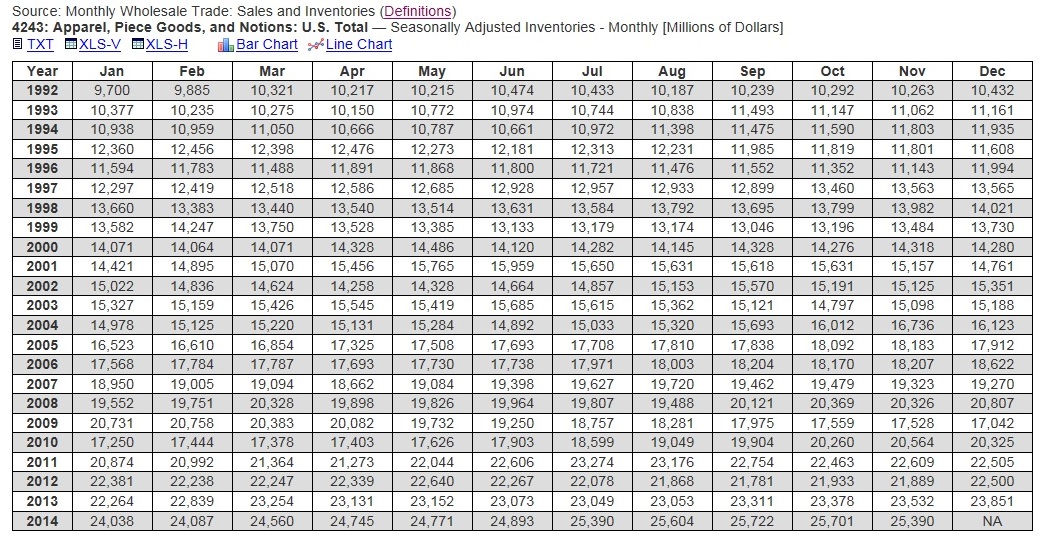
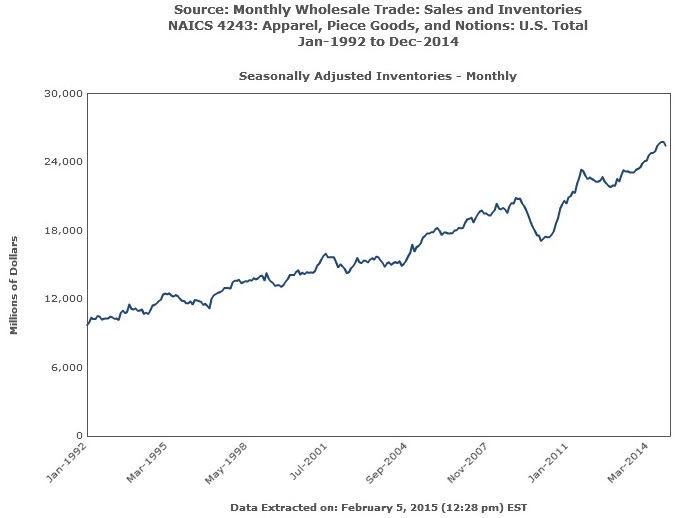
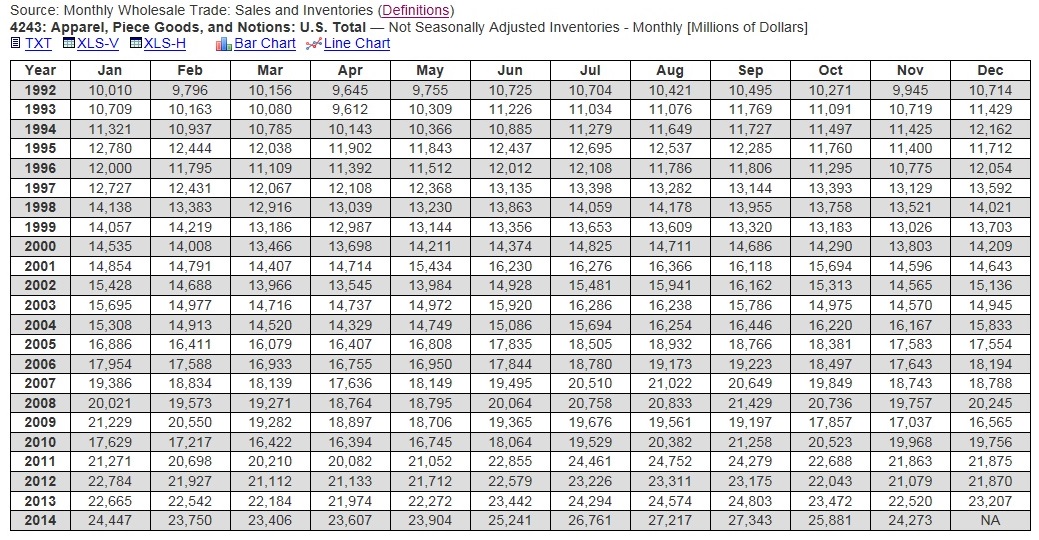
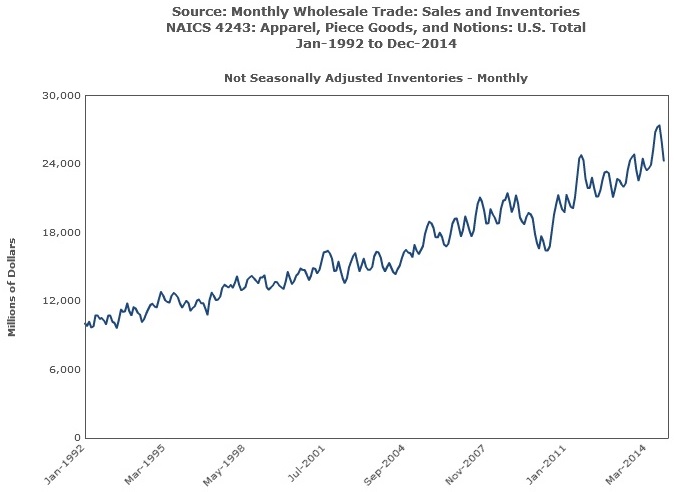
These charts present the Monthly Wholesale Trade inventory series for apparel, piece goods and notions — industry 4243, United States total inventory, monthly — from 1992 to 2014, built from United States Census data retrieved on February 5, 2015. Wholesale inventory is the pipeline's reservoir: the stock merchant wholesalers hold between manufacturers and retailers, rising when goods move slower than expected and draining when retail demand pulls them through. The charts present the series in seasonally adjusted and not seasonally adjusted form, each with a line presentation, and the survey's notes on reliability and sampling variability are carried with the data. The figures are historical reference; the charts are not updated, and revisions to source data may occur.

Monthly Wholesale Trade: Sales and Inventories
4243: Apparel, Piece Goods, and Notions: U.S. Total
Inventory
Monthly
Apparel Search has utilized data from the USA Census to create the following historical information to help fashion industry researchers learn more about our industry. The data was retrieved on February 5, 2015.
Revisions to the original source data may occur, but we will NOT be
updating the charts listed on this page. If you wish to utilize this
information, it is important to keep in mind that the data can possibly be
outdated due to potential revisions.
For the Monthly Wholesale Trade Survey, all current month estimates are
preliminary estimates and will be superseded in following months by revised
estimates.
For information on the reliability and use of the data, including important
notes on estimation and sampling variance, seasonal adjustment, measures of
sampling variability, and other information pertinent to this economic
indicator, go to the
Monthly Wholesale Trade Report [PDF], or refer to the
Monthly and Annual Wholesale Trade website, which provides a link to
more
historical data for these reports.
Estimated measures of sampling variability for totals are expressed as
coefficients of variation (CV). Standard errors (SE) are provided for
month-to-month change and ratio estimates.
Estimated measures of sampling variability are based on data not adjusted
for seasonal variation, and should be used when drawing inferences about
both adjusted and not adjusted estimates.
The Y-axis for the line charts may be truncated to prevent flattening of the
lines or to present the complete range of data.
How the Monthly Wholesale Trade Figures Work
All current-month estimates in the Monthly Wholesale Trade Survey are preliminary estimates and will be superseded in following months by revised estimates. The Monthly Wholesale Trade Report and the Monthly and Annual Wholesale Trade website provide the reliability documentation and links to more historical data for these reports. Estimated measures of sampling variability are expressed as coefficients of variation (CV), with standard errors (SE) provided for month-to-month change and ratio estimates, based on data not adjusted for seasonal variation and used when drawing inferences about both adjusted and not adjusted estimates. The line charts' Y-axes may be truncated to prevent flattening of the lines or to present the complete range of data, so values should be read from the data rather than estimated from a slope.
Reading Inventory Against Sales
Inventory alone is half a diagnosis. Read beside the companion monthly sales series in this collection, the inventories-to-sales relationship shows the pipeline's pressure: stock building faster than sales move is the wholesale signature of a coming markdown season at retail, while stock drawn down against rising sales signals the replenishment demand that reaches manufacturers next. The wholesale definitions page explains the trade's vocabulary — distributors, agents and brokers, cost of goods sold — and the 1992-2014 span lets a researcher watch that pressure build and release across two full business cycles in the apparel trade.
Common Questions
What do these charts measure?
United States total monthly wholesale inventory for apparel, piece goods and notions (industry 4243) from 1992 to 2014, from Census Monthly Wholesale Trade data retrieved February 5, 2015.
Why read wholesale inventory together with wholesale sales?
The inventories-to-sales relationship shows pipeline pressure: stock building faster than sales signals coming markdowns, while stock drawn down against rising sales signals replenishment demand.
Are the monthly estimates final?
No. All current-month estimates are preliminary estimates and will be superseded in following months by revised estimates.