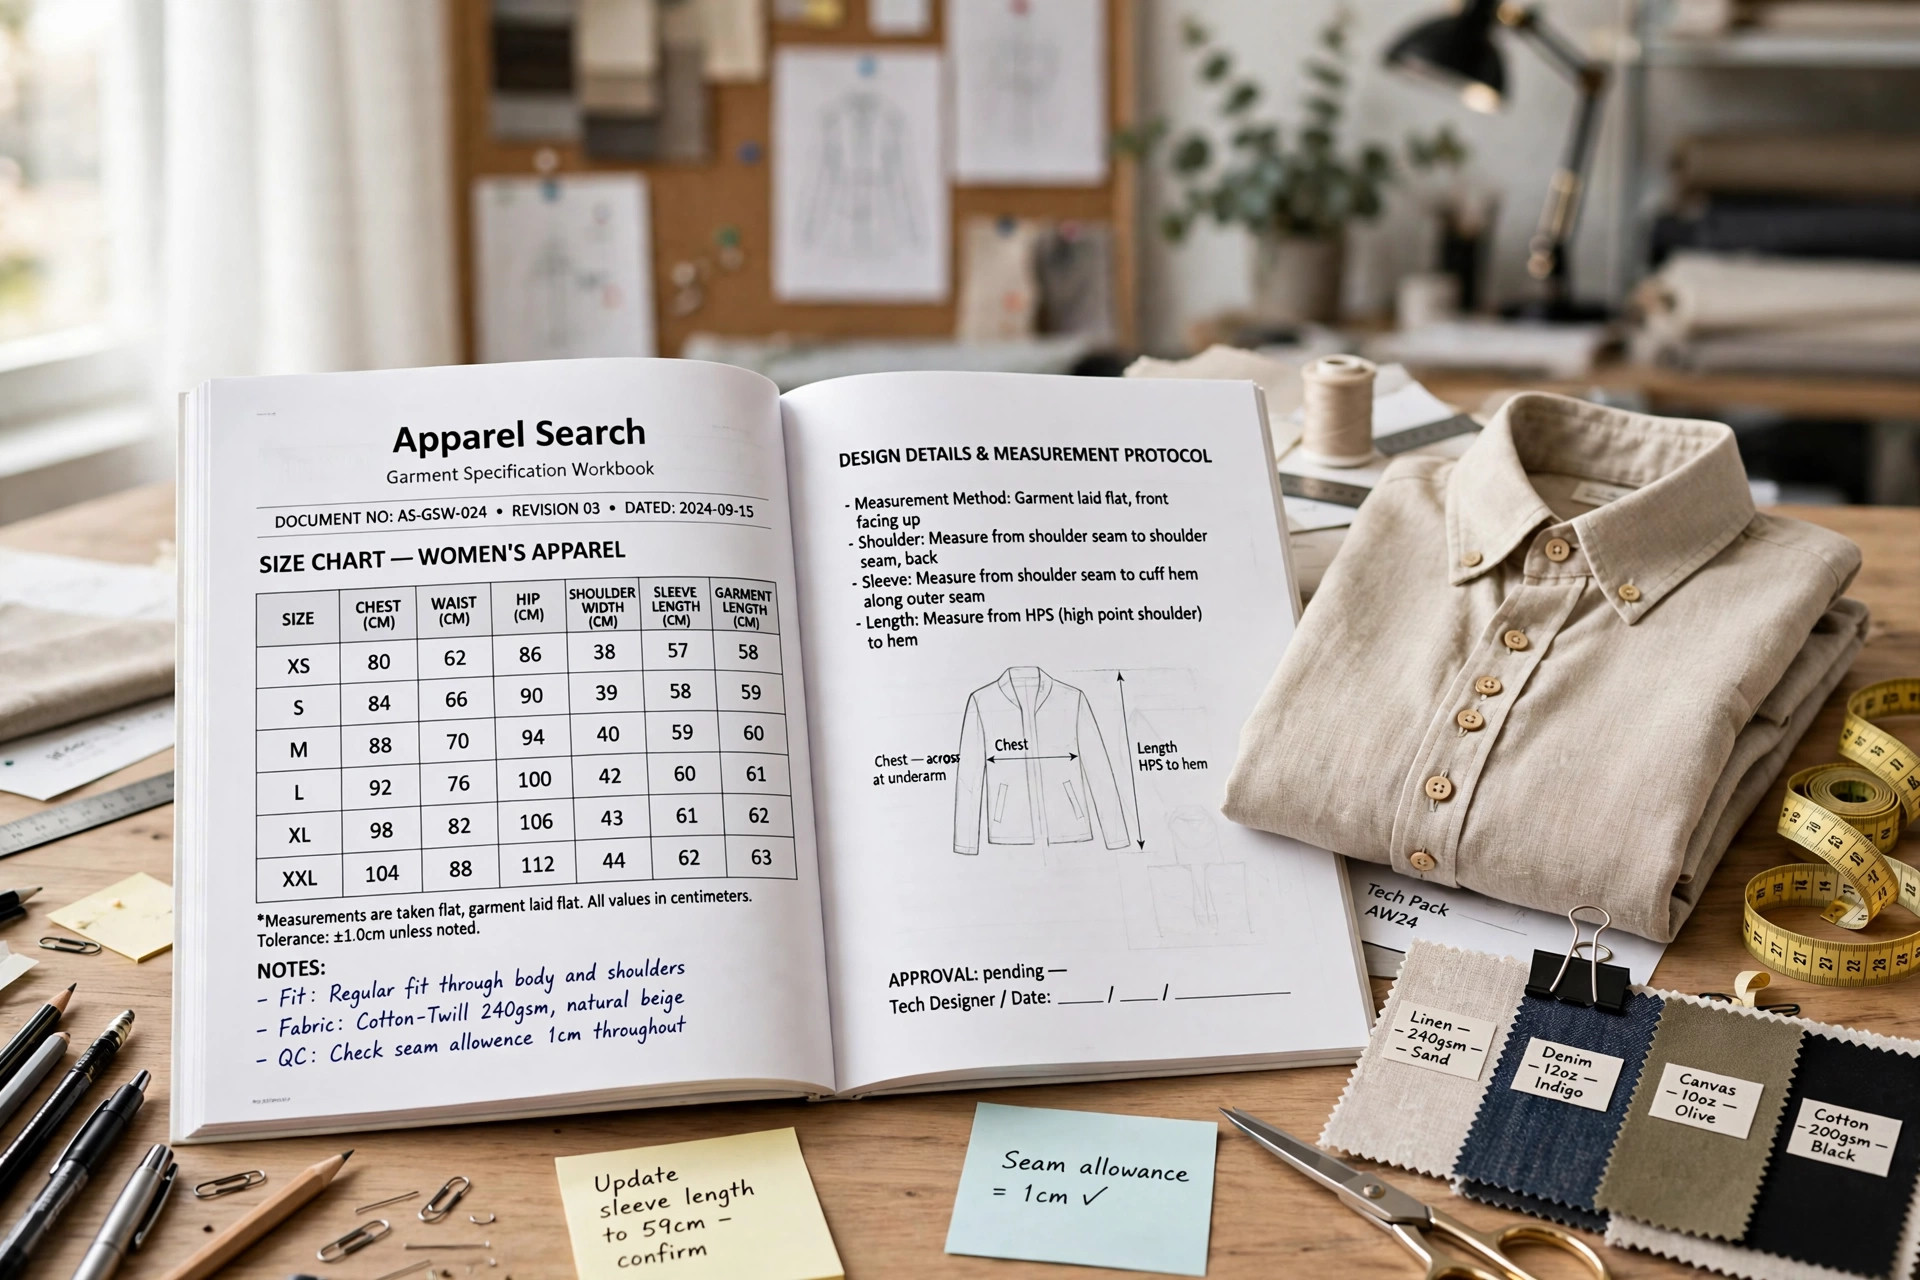
A size chart looks simple — a grid of sizes and numbers — but it is the published extract of a brand's entire sizing system, and it can be built from two completely different kinds of numbers. This page explains where chart numbers come from, as part of our Clothing Sizing & Fit Guide. If you are building a chart yourself, our step-by-step how to create a size chart is the practical companion; this page covers the reasoning underneath those steps, so you can also read any other brand's chart with a technician's eye.
Two Kinds of Numbers
Body measurement charts describe the customer. "Size 12: bust 97 cm, waist 79 cm, hip 103 cm" means the size was designed for a body measuring about that. You compare your own body — measured following guides like our body measurements pages — and pick the size whose range holds you.
Garment measurement charts describe the clothing. They come from the technical specification (the "spec"), which lists points of measure — POMs — for the finished garment: chest width, front length, sleeve length, waist relaxed and stretched, and so on, size by size. Garment numbers are bigger than body numbers at the same point, and the difference is ease: the wearing room and design room built into the garment.
The single most common size-chart misunderstanding: holding a garment chart against your body measurements (or the reverse) and concluding the brand's sizing is "off by two inches". It usually isn't — the two charts are measuring different things.
Well-run brands label which kind of chart they are publishing. Many don't, which is why a shopper's most useful skill is recognising the signs: garment charts list lengths and widths of the item itself (shoulder, sleeve, hem sweep), while body charts list the classic fitting triad of bust, waist and hip, sometimes with height or inseam for orientation.

Where the Numbers Come From
Working backwards, a published body chart rests on three decisions. First, the brand's size system: the body dimensions assigned to each size, drawn from anthropometric data for its target customer — not for the general population, unless the brand sells to everyone. Second, the intervals between sizes: how much bust, waist and hip each step adds, which must match the grade rules used on the patterns, or chart and garment will tell different stories. Third, rounding and presentation: numbers are rounded to friendly halves and quarters, inches in some markets and centimetres in others, sometimes converted — and every conversion is a chance for a half-centimetre to wander.
Garment charts come from a different document entirely: the production spec, where the technical designer records the approved measurements of the fit-approved sample and the graded values for every other size. Between the spec and the website, marketing usually trims dozens of POMs down to the handful shoppers ask about — which is why the measurement you personally need is so often the one that got trimmed.
Tolerance: The Fine Print Nobody Prints
Every number on an internal spec carries a tolerance, written ±, stating how far a production garment may measure from the target and still pass quality inspection. On major girths a tolerance around 1–2 cm is common; on small details it is tighter. Sewing is a soft process — fabric relaxes, presses, shrinks slightly in finishing — so exactness is not physically available at production scale, and the industry prices that reality in rather than pretending otherwise.
For shoppers, tolerance explains the mystery of two "identical" garments fitting slightly differently, and why a chart should be read as a range rather than a promise. For brands, it explains why the chart numbers are usually the target measurements, not a guarantee about the specific unit in the parcel. When you build your own chart using our size chart guide, decide consciously whether you are publishing target garment measurements, body ranges, or both — and say so on the page.
Why Charts Differ Between Brands and Markets
Even two brands publishing honest body charts will differ, because their systems differ: different target bodies, different intervals, different rounding. Layer markets on top and it multiplies — a chart written for the US in inches, converted to centimetres for Europe, then relabelled into local sizes using the conventions in sizing systems around the world, accumulates small choices at every step. The chart is not lying; it is reporting a different system. The shopper's defence is always the same: trust measurements, not labels, and prefer the brand whose chart is built on bodies like yours.
Common Questions
- What is the difference between a body measurement chart and a garment measurement chart?
- A body measurement chart tells you which body the size is designed for — your bust, waist and hip should fall in the stated range. A garment measurement chart (a spec or POM chart) gives the dimensions of the finished garment itself, which are larger than the body by the amount of ease. The two charts for the same size will show different numbers, and both can be correct.
- What does tolerance mean on a size chart?
- Tolerance is the permitted variation around a specified measurement — often written as ± and commonly around 1 to 2 cm on major girths, less on small details. Sewing is a soft process: fabric stretches, shrinks and shifts, so a production garment is accepted if it measures within tolerance of the spec, not exactly on it.
- Why do garment measurements get doubled?
- Garments are usually measured laid flat, which captures half the girth — across the chest from side seam to side seam, for example. That half measurement is doubled to state the full circumference so it can be compared with a body measurement. Charts and spec sheets should say which they are showing; when they don't, a suspiciously small number is usually the flat half.
- Why doesn't every brand publish the same measurements?
- Because brands choose the points of measure their customers need and their patterns use. One brand lists bust, waist and hip; another adds shoulder, sleeve and inseam. Internally, a full spec sheet can run to dozens of points of measure, but publishing all of them would overwhelm shoppers — so the public chart is an edited extract of a much larger internal document.
More from the Sizing & Fit Guide
Back to the Clothing Sizing & Fit Guide A size chart is the last link in the sizing chain. See the whole system in the Sizing & Fit Guide hub.